Designed for – Class III-X
Time – 30 minutes
Objectives
Urban heat island is considered a consequence of the massive growth rate in the cities. It usually means the higher temperature at urban cities as compared to their rural surroundings. The objective of the experiment is to understand why urban green and blue infrastructures are necessary and also visualize why some part of the city is hotter than other.
Prerequisites
A brief description of urban heat island and the surface that absorb more sunlight than others is necessary.
Tools required
Digital Infrared thermometer (does not have to be very high-end)
 Methods
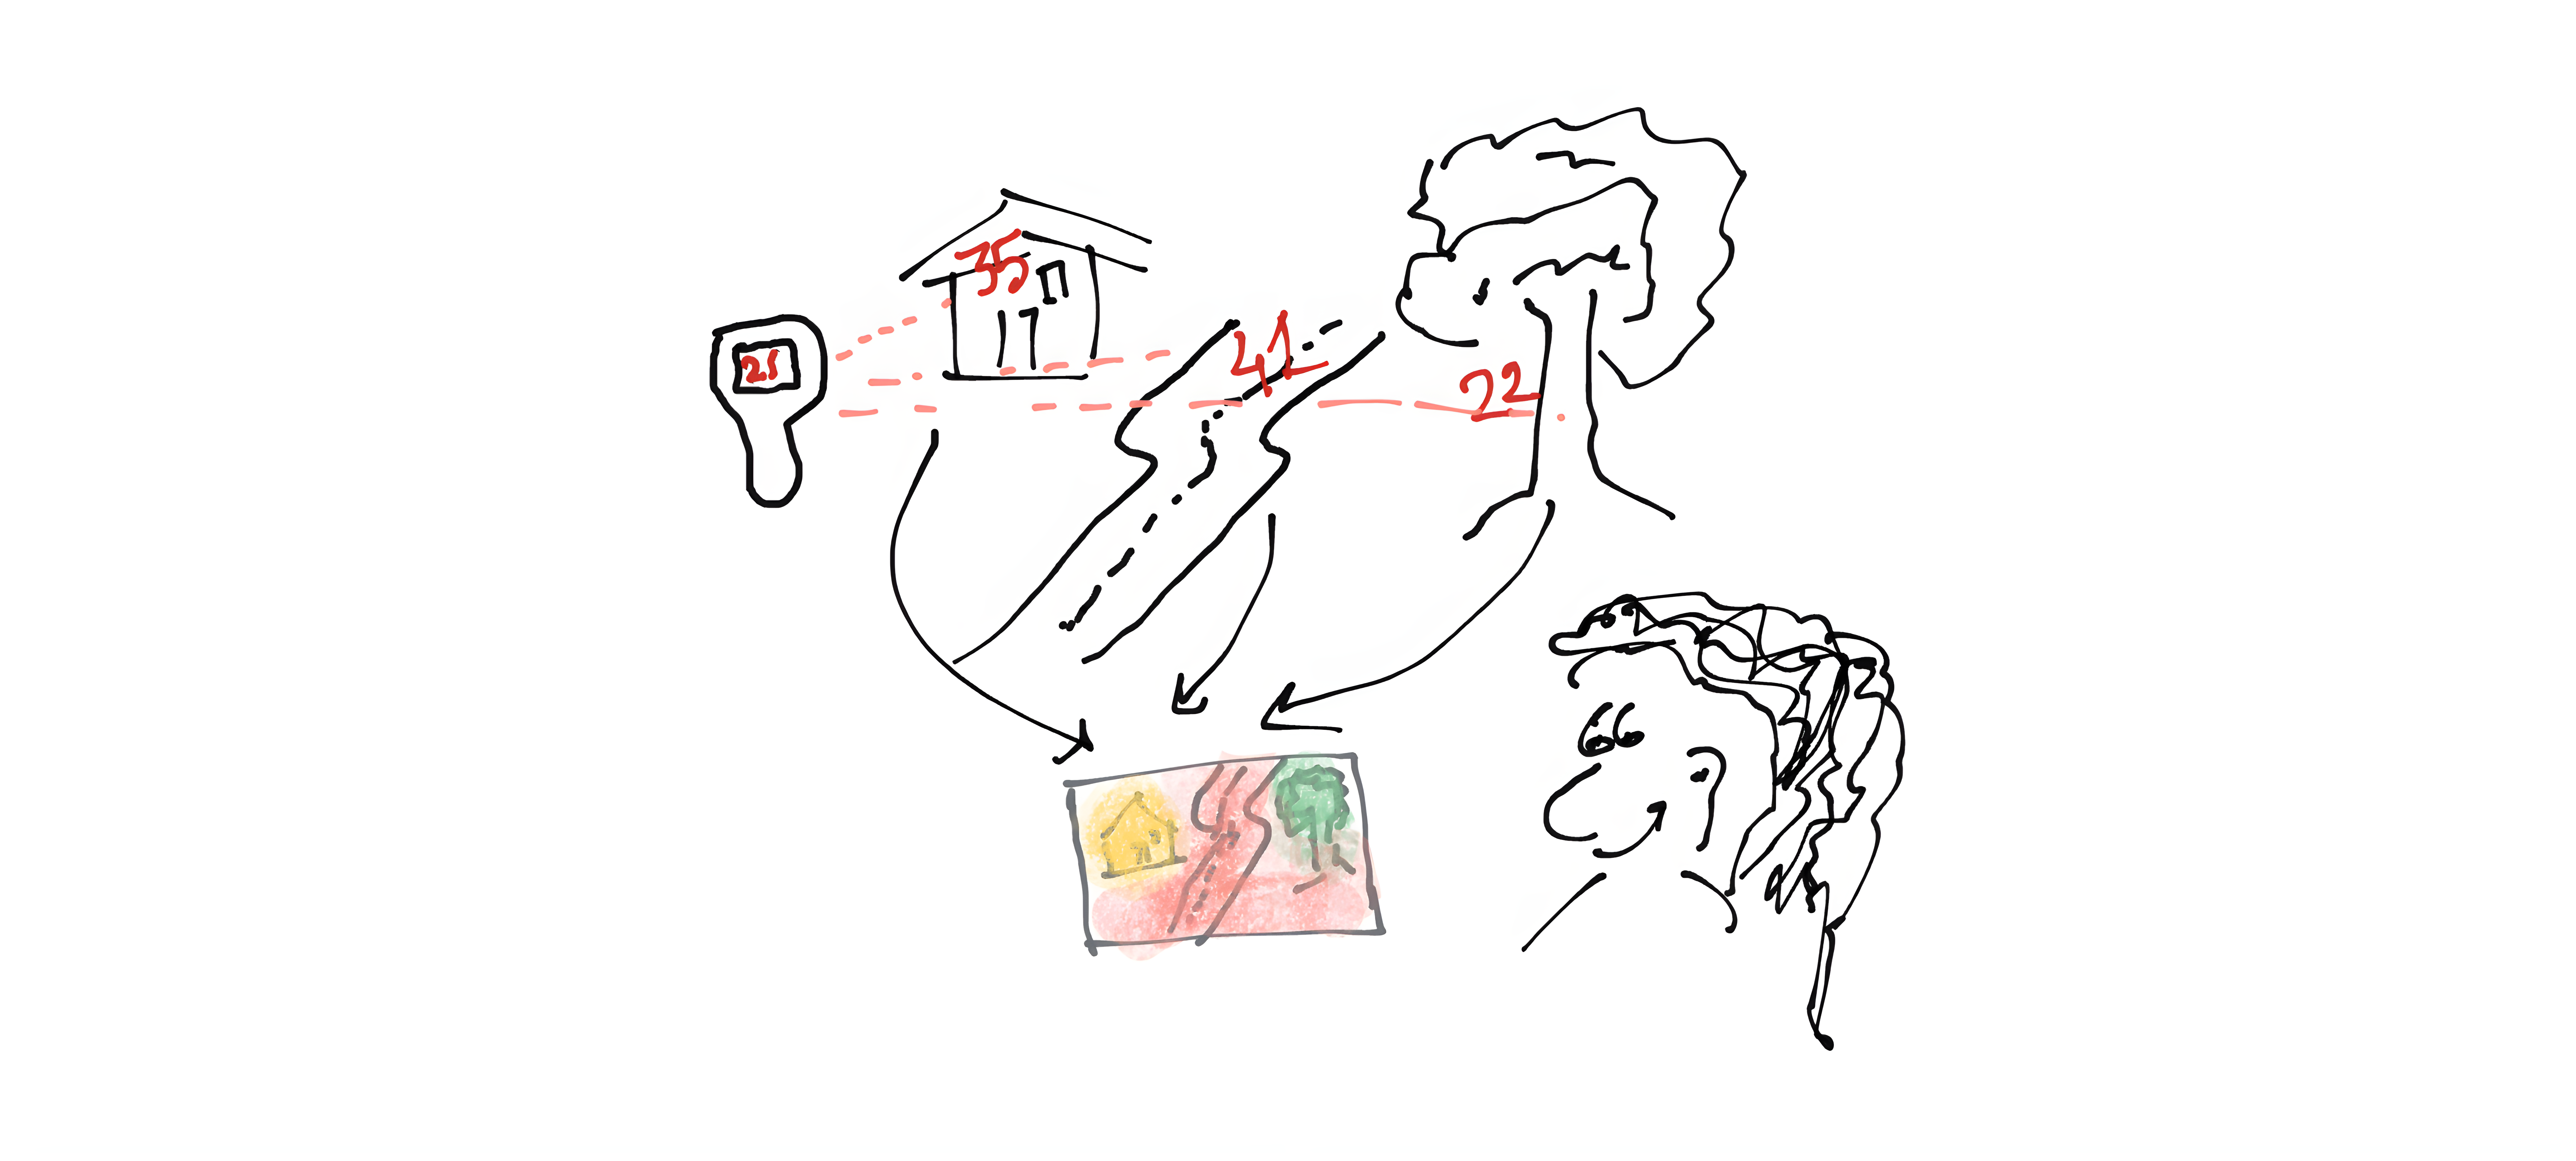
Take the students outside of the classroom and pointed out the infrared thermometer to various objects like concrete, pitch, vegetation water bodies etc. Write down the reading in a notebook.
Expected results
You can expect even a 15-degree or more difference in temperature for vegetation vs concrete. Homes made up of cement and mud should show different temperatures. Try to do this at a landscape scale where different land-use types are present. Tell the student about how differential temperature exists in different land use.
Pro-tips
Select a landscape and take as much temperature data as possible. Click an image of the landscape and use a free online platform (https://tech-lagoon.com/imagechef/en/image-to-edge.html) to convert the image into outlines. Now take a rainbow color (7 colors, blue to red) sketch pen and ask the students to color according to temperature (blue = cold, green = hot, yellow = hotter and red = hottest; like this).